

Group traces into threads
To associate traces together into a thread, you need to pass in a specialmetadata key where the value is the unique identifier for that thread. The key name should be one of:
session_idthread_idconversation_id
uuid7 helper (Python v0.4.43+, JS v0.3.80+):
- Python:
from langsmith import uuid7 - JS/TS:
import { uuid7 } from 'langsmith'
Example
This example demonstrates how to log and retrieve conversation history using a structured message format to maintain long-running chats. The example generates aTHREAD_ID with uuid7() and passes it via metadata to @traceable, linking every run from that session into the same thread in LangSmith. Conversation history is persisted locally between turns—replace the file-based store with a database or cache in production. The get_chat_history flag controls whether the pipeline continues an existing thread or starts a fresh one:
get_chat_history=True,/getChatHistory: true, you can continue the conversation from where it left off. This means that the LLM will receive the entire message history and respond to it, instead of just responding to the latest message:
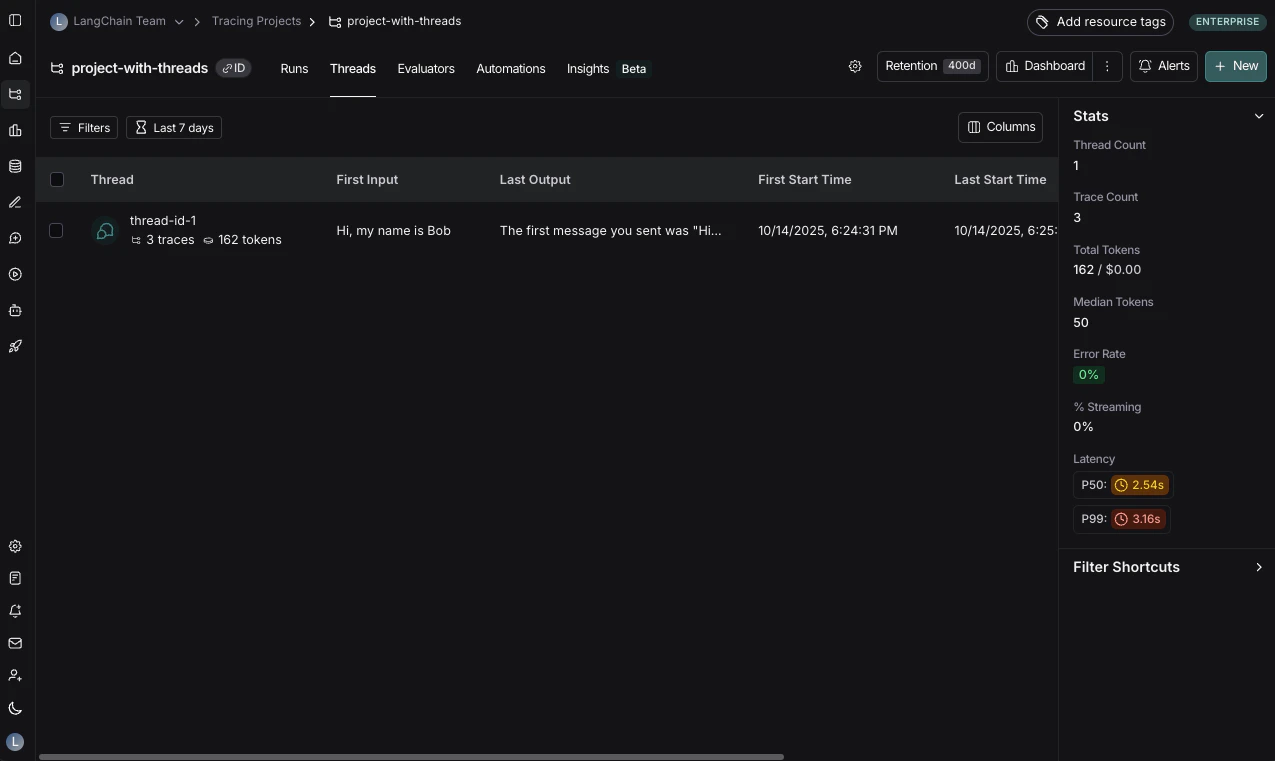
View threads
You can view threads by clicking on the Threads tab in any project details page. You will then see a list of all threads, sorted by the most recent activity.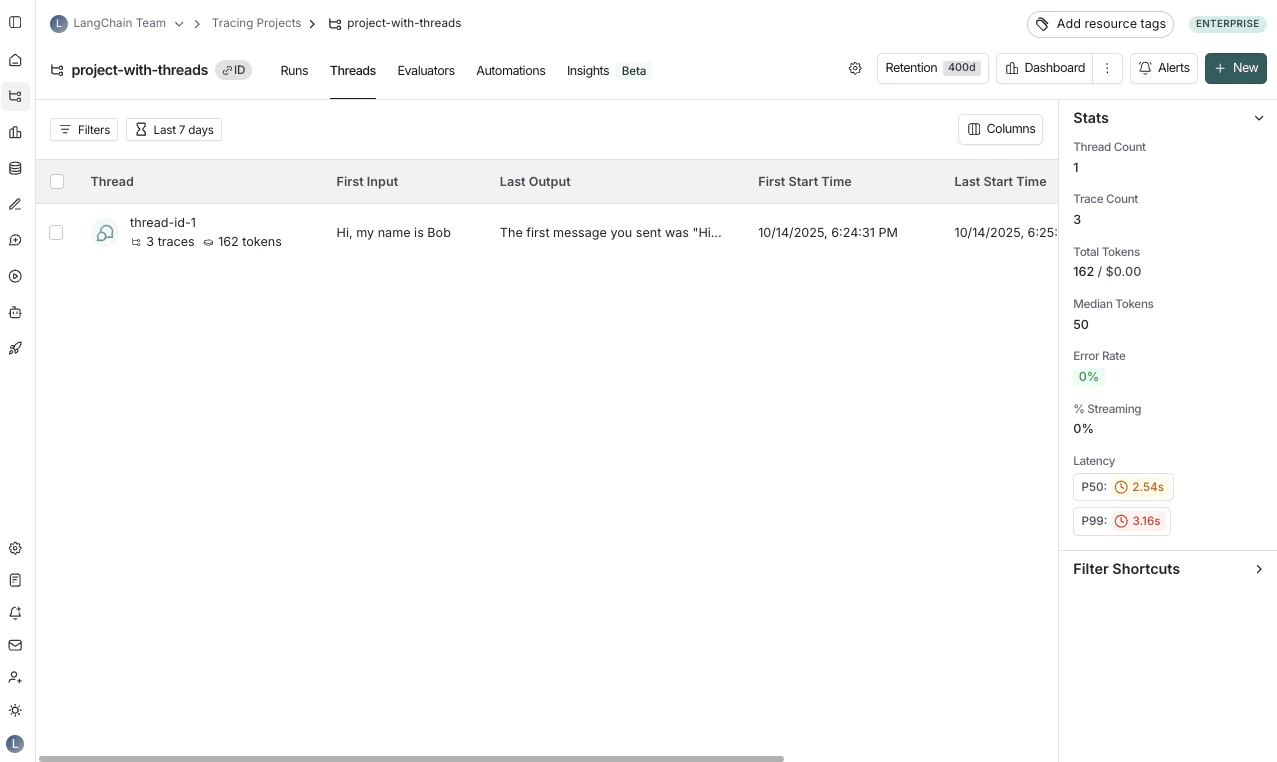
Use Polly in thread views to analyze conversation threads, understand user sentiment, identify pain points, and track whether issues were resolved.
T to toggle between the two views.
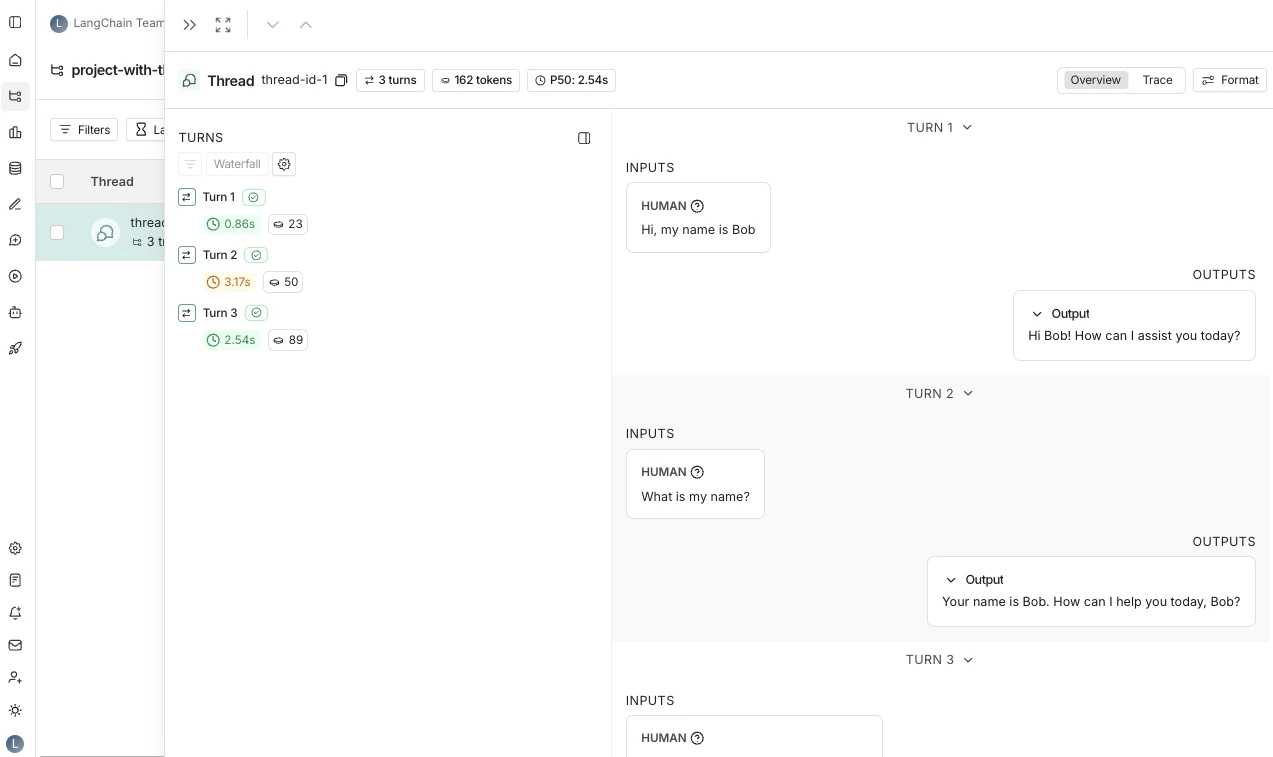
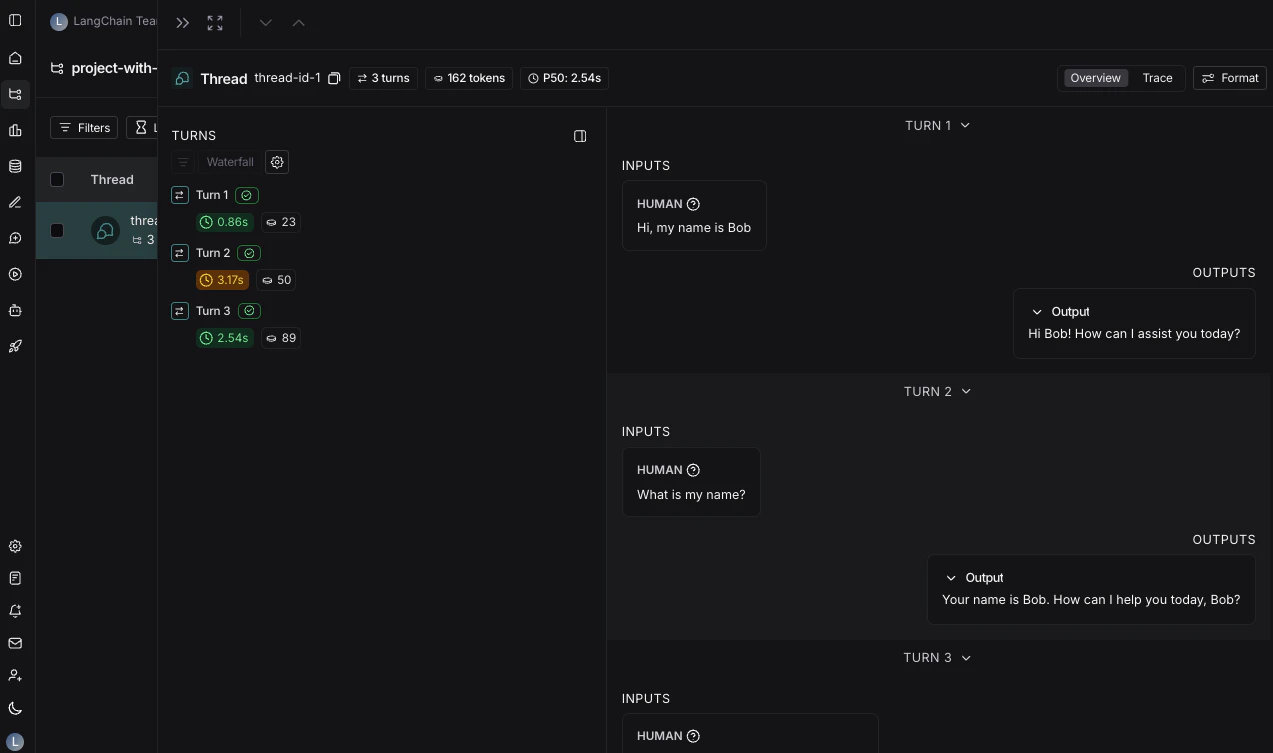
Thread overview
The thread overview displays each turn of the conversation sequentially, showing the inputs and outputs for each trace in the thread. You can configure which fields in the inputs and outputs are displayed in the overview, or show multiple fields by clicking the Configure button. The JSON path for the inputs and outputs supports negative indexing, so you can use-1 to access the last element of an array. For example, inputs.messages[-1].content will access the last message in the messages array.
Trace view
The trace view for threads is similar to the trace view when looking at a single run, except that you have access to all the runs for each turn in the thread.View feedback
When viewing a thread, across the top of the page you will see a section called Feedback. This is where you can review the feedback for each of the runs that make up the thread. This feedback is aggregated, so if you evaluate each run of a thread for the same criteria, you will see the average score across all the displayed runs. You can also see thread-level feedback left here.Save thread-level filter
Thread filters look through all runs and surface a thread if at least 1 run matches the filter.
Related
- Observability concepts: background on threads and how they relate to runs and traces.
- Add metadata and tags to traces: how to pass
thread_idand other metadata keys. - Filter traces: filter by thread metadata in the tracing UI.
- Set up multi-turn online evaluators: evaluate threads rather than individual runs.
- Log user feedback using the SDK: attach feedback to runs within a thread.
Connect these docs to Claude, VSCode, and more via MCP for real-time answers.